Walmart Inc., Elliott Wave Technical Analysis
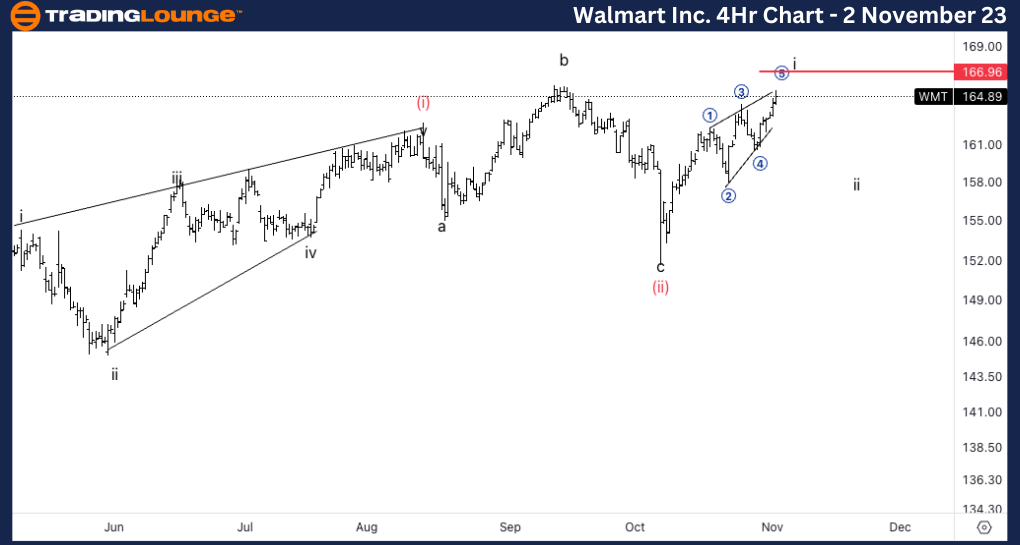
Walmart Inc., (WMT:NYSE): 4h Chart, 2 November 23
WMT Stock Market Analysis: We have been looking for a flat in wave (ii) and we have resumed higher ever since we anticipated a bottom in place. At this point it looks like we could be forming a leading diagonal into wave i or else we could be making a series on wave ones and two.
WMT Elliott Wave Count: Wave i of (iii).
WMT Technical Indicators: Above all averages.
WMT Trading Strategy: Looking for longs after the pullback in wave ii.
TradingLounge Analyst: Alessio Barretta
Source: Tradinglounge.com get trial here!
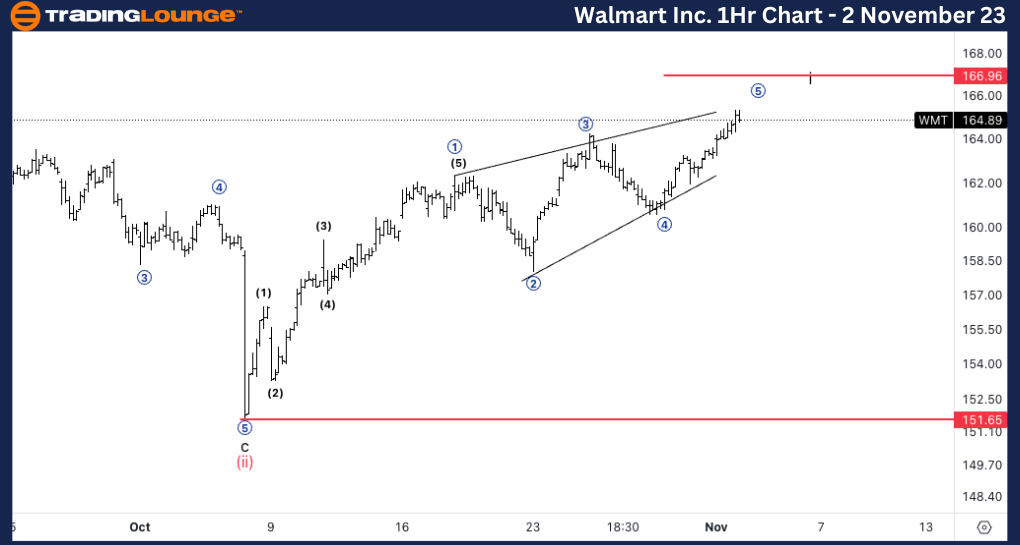
Walmart Inc., WMT: 1-hour Chart, 2 November 23
Walmart Inc., Elliott Wave Technical Analysis
WMT Stock Market Analysis: Invalidation level for the leading diagonal stands at 166.9$ which is equality of 5 vs. 3. Downside invalidation stands at 151$. If the diagonal scenario plays out we could expect wave ii to end near the wave 2 of the diagonal at around 158$.
WMT Elliott Wave count: Wave 5 of i.
WMT Technical Indicators: Above all averages.
WMT Trading Strategy: Looking for longs after the pullback in wave ii.